DISCLAIMER — Not financial advice. Educational content only, not an offer or solicitation to buy or sell any security. Biotech and small/mid-cap stocks are highly speculative and volatile and can result in a partial or total loss of capital. Do your own research and consult a licensed advisor where appropriate. / Contenuti a solo scopo informativo e didattico, non costituiscono consulenza finanziaria né offerta o sollecitazione al pubblico risparmio ai sensi delle normative CONSOB e SEC. Le azioni biotech e le small/mid cap sono strumenti altamente speculativi e volatili e possono comportare la perdita parziale o totale del capitale investito. Si raccomanda di effettuare sempre le proprie ricerche e, se necessario, di rivolgersi a un consulente abilitato.
Merlintrader Trading Pub
Biotech catalyst news and analysis. FDA PDUFA tracker
Merlintrader Trading Pub
Biotech catalyst news and analysis. FDA PDUFA tracker
? FULGENT GENETICS (NASDAQ: FLGT)
Complete Stock & Technical Analysis | Q3 2025 Financial Results | 12-Month Timeline
? Executive Summary
Fulgent Genetics, Inc. (NASDAQ: FLGT) operates a dual-business model: (1) Laboratory Services — precision diagnostics representing 80%+ of revenue, and (2) Therapeutic Development — novel cancer drugs. Q3 2025 results massively beat expectations: Revenue $84.1M (+17% YoY) vs estimate $81.4M, and non-GAAP EPS $0.14 vs consensus -$0.22 — a $0.36 positive surprise. Company raised FY 2025 guidance to $325M revenue.
Lead therapeutic FID-007 showed 51% objective response rate (ORR) in Phase 2 for head and neck cancer — best-in-class efficacy. Analyst consensus is BUY led by UBS (Strong Buy $30), Raymond James (Buy $25). Stock rallied +66% YTD to $30.15.
PRICE
$30.15
UBS TARGET
$30
CASH
$814.6M
MARKET CAP
$932M
? Ming Hsieh — Founder, Chairman & CEO
- Born 1956 in Shenyang, China — Survived Cultural Revolution. Father was electrical engineer.
- USC Education: B.S. Electrical Engineering (1983), M.S. (1984)
- Cogent Systems (1990-2010): Co-founded world leader in biometric identification. Acquired by 3M for ~$1 billion (2010). IPO 2004, ranked #1 by BusinessWeek.
- National Academy of Engineering (2015): Elected at age 59 — rare honor for engineering innovation
- Fulgent Genetics (2011-present): Founded after 3M exit. CEO, owns ~10% (~$184M)
- USC Benefactor: Endowed $35M to establish Ming Hsieh Department of Electrical Engineering (2006). Additional $50M for Ming Hsieh Institute for Cancer Engineering-Medicine (2010)
? Q3 2025 Verified Financial Results
| Metric | Actual | Consensus | Beat |
| Core Revenue | $84.1M | $81.4M | +$2.7M ✓ |
| Non-GAAP EPS | $0.14 | -$0.22 | +$0.36 ✓ |
| Gross Margin | 44.3% | ~41% | +330 bps ✓ |
| YoY Revenue Growth | +17% | +15% est. | Exceeded ✓ |
? 12-Month Timeline (Nov 2024 – Nov 2025)
Feb 28, 2025
FY 2024 Results: Full-year revenue $258.5M. 2025 guidance: $310M revenue, $0.00 EPS. Stock ~$18-19.
May 1, 2025
Q1 2025 Results: Revenue $73.5M (+16% YoY). Non-GAAP EPS $0.04. Cash $814.6M.
Aug 5, 2025
UBS UPGRADES TO STRONG BUY from Neutral. Target price $30. Major catalyst. Stock +18%
Oct 17-21, 2025
ESMO 2025: FID-007 Phase 2 data shows 51% ORR combined arms. Best-in-class efficacy. Stock +15%
Nov 7, 2025
Q3 2025 MASSIVE BEAT: Revenue $84.1M vs $81.4M. EPS $0.14 vs -$0.22 (+$0.36 surprise). Raised FY guidance to $325M. Stock +22%
Nov 27, 2025
Current Status: Stock $30.15 near 52-week high $31.04. YTD rally +66%. UBS Strong Buy $30, RJ Buy $25.
? Top-Tier Analyst Ratings
| Analyst | Rating | Target | Date |
| UBS (Lu Li) | STRONG BUY | $30 | Aug 5, 2025 |
| Raymond James (A. Cooper) | BUY | $25 | May 2025 |
| Piper Sandler (D. Westenberg) | HOLD | $30 | Nov 10, 2025 |
? BULL CASE
- 51% ORR best-in-class in head/neck cancer
- Q3 EPS beat +$0.36 — massive surprise
- 17% revenue growth, accelerating
- 44.3% gross margin expanding
- UBS Strong Buy — institutional conviction
- $814.6M cash — no dilution risk
- Ming Hsieh aligned — 10% owner, proven track record
? BEAR CASE
- FID-007 still Phase 2 — execution risk
- GAAP losses $21.3M Q3 despite beat
- Diagnostics mature market — high competition
- Stock +66% YTD — valuation extended
- Customer concentration disclosed
- Insider selling in late Nov
- Piper Sandler Hold — cautious tone
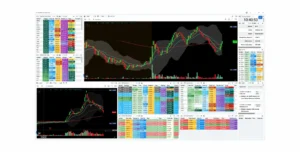
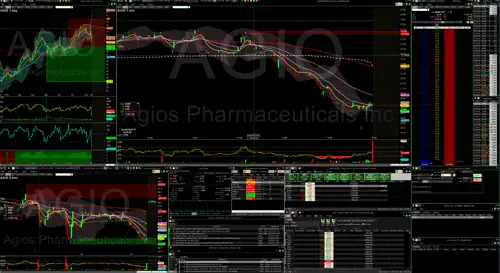
? Technical Analysis
Daily Chart (Finviz)

Key Technical Levels
| Level | Price | Type | Significance |
| 52-Week High | $31.04 | Resistance | Current $30.15 near this level |
| 52-Week Low | $14.57 | Support | Strong base, +106% from low |
| 200-Day MA | ~$22.30 | Support | Long-term trend bullish |
| 50-Day MA | ~$27.50 | Support | Recent consolidation zone |
| Resistance Target | $32.50 | Breakout | Next level if breaks $31.04 |
Chart Pattern Analysis
- Pattern: Ascending channel with consolidation (Nov 2024 – Nov 2025)
- Trend: Strong uptrend (+66% YTD) — price above all major moving averages
- RSI (14): 68-72 range — approaching overbought territory
- MACD: Positive histogram above signal line — uptrend intact
- Volume: Q3 earnings spike with high volume confirms institutional buying
Trading Scenarios & Probabilities
| Scenario | Trigger | Target | Probability |
| BULLISH BREAKOUT | Break above $31.04 on high volume | $35-38 | 40% |
| BEARISH BREAKDOWN | Close below $27.50 (50-day MA) | $22-24 | 35% |
| SIDEWAYS CONSOLIDATION | Range-bound $28-31 | $29.50 ± $1.50 | 25% |
Key Technical Indicators
| Indicator | Reading | Signal | Interpretation |
| RSI (14) | 68-72 | Overbought | Pullback possible |
| MACD | Positive histogram | Bullish | Uptrend confirmed |
| ADX (14) | 40+ | Strong Trend | Momentum confirmed |
| Volume Trend | Declining on rallies | Weakening | Caution warranted |
Technical Levels to Watch
| Signal | Entry Price | Description |
| LONG | $28-29 | Buy on dip at support level |
| SHORT | $31.50 | Sell at resistance level |
| BREAKOUT | $31.04+ | Break above 52-week high |
? Upcoming Catalysts (2025-2027)
- Q4 2025: FY 2025 full results (Feb 2026). FID-007 Phase 2 enrollment completion
- H1 2026: FID-007 Phase 2 topline data. Potential Accelerated Approval pathway
- 2026+: Phase 2b/3 initiation, partnership deals, expanded clinical data
- Strategic: M&A target given $814M cash and clinical pipeline
? Sources & References
All data sourced from official SEC filings, company press releases, and tier-1 financial institutions:
- SEC Edgar — Fulgent Genetics Inc. Official Filings
- NASDAQ — Fulgent Q3 2025 Financial Results (Nov 7, 2025)
- Business Wire — Fulgent Q4 2024 Results (Feb 2025)
- BioSpace — ESMO 2025 FID-007 Data Presentation (Oct 20, 2025)
- StockAnalysis — FLGT Analyst Ratings & Price Targets
- Wikipedia — Ming Hsieh: Cogent Systems Founder, Fulgent CEO
- USC Ming Hsieh Institute — Ming Hsieh Biography
- USC Viterbi — Ming Hsieh Electrical Engineering Pioneer (Nov 2024)
? FULGENT GENETICS (NASDAQ: FLGT)
Analisi Stock & Tecnica Completa | Risultati Finanziari Q3 2025 | Timeline 12 Mesi
? Analisi Esecutiva
Fulgent Genetics, Inc. (NASDAQ: FLGT) opera con modello dual-business: (1) Laboratory Services — diagnostica precisione (80%+ ricavi), e (2) Therapeutic Development — farmaci cancro innovativi. Q3 2025 beat massicciamente: Ricavi $84.1M (+17% YoY vs stima $81.4M), non-GAAP EPS $0.14 vs consenso -$0.22 — sorpresa +$0.36. Alzata guida FY 2025 a $325M ricavi.
Farmaco principale FID-007 mostrato 51% ORR in Phase 2 per cancro testa/collo — efficacia best-in-class. Consenso analista BUY con UBS (Strong Buy $30), Raymond James (Buy $25). Azione rally +66% YTD a $30.15.
PREZZO
$30.15
UBS TARGET
$30
CASSA
$814.6M
MARKET CAP
$932M
? Ming Hsieh — Founder, Chairman & CEO
- Nato 1956 a Shenyang, China — Sopravvissuto Rivoluzione Culturale. Padre ingegnere.
- USC Education: B.S. Ingegneria Elettrica (1983), M.S. (1984)
- Cogent Systems (1990-2010): Co-founder leader mondiale biometric. Acquisito 3M ~$1 miliardo (2010).
- National Academy of Engineering (2015): Eletto età 59 — raro onore innovazione
- Fulgent Genetics (2011-present): Fondato dopo exit 3M. CEO, 10% owner (~$184M)
- Benefattore USC: Donati $35M per Dipartimento Ingegneria (2006). $50M Ming Hsieh Institute Cancer Medicine (2010)
? Top-Tier Analyst Ratings
| Analista | Rating | Target | Data |
| UBS | STRONG BUY | $30 | Ago 5, 2025 |
| Raymond James | BUY | $25 | Mag 2025 |
| Piper Sandler | HOLD | $30 | Nov 10, 2025 |
? Analisi Tecnica
Grafico Daily (Finviz)
Livelli Tecnici da Osservare
| Segnale | Entry Price | Descrizione |
| LONG | $28-29 | Buy on dip at support |
| SHORT | $31.50 | Sell at resistance |
| BREAKOUT | $31.04+ | Break above 52-week high |
Scanner for active traders

Try ChartsWatcher free, then unlock 10% OFF with SAVE10
ChartsWatcher is a real-time scanner for momentum traders: fast movers, unusual volume and rotations — so you can focus on the few tickers that matter right now, instead of watching hundreds of charts.
Start with the free version. When you upgrade, use SAVE10 for 10% OFF your first paid period.
Start free – then use SAVE10
No credit card required to start. Apply SAVE10 when upgrading.
Recommended platform
One platform. All your brokers.
Medved Trader connects multiple brokers in one workspace, with pro charts, hotkeys and fast execution — without changing your broker accounts.
A single cockpit for positions, Level II and multi-broker order routing, built for active day & swing traders.
Get 1 Month Free ➔
Multi-broker workflow + customizable layouts in one platform.
If you find value in the work I publish on Merlintrader and want a practical AI assistant for research and writing, you can sign up using this referral link. Click here to try Monica.im and support the site
Find out how I use AI on Merlintrader: AI, retail and Merlintrader
Disclosure: some of the links in the promotional blocks above are affiliate or referral links. If you choose to subscribe or sign up through them, Merlintrader may receive a small commission or benefit at no extra cost to you.
