DISCLAIMER — Not financial advice. Educational content only, not an offer or solicitation to buy or sell any security. Biotech and small/mid-cap stocks are highly speculative and volatile and can result in a partial or total loss of capital. Do your own research and consult a licensed advisor where appropriate. / Contenuti a solo scopo informativo e didattico, non costituiscono consulenza finanziaria né offerta o sollecitazione al pubblico risparmio ai sensi delle normative CONSOB e SEC. Le azioni biotech e le small/mid cap sono strumenti altamente speculativi e volatili e possono comportare la perdita parziale o totale del capitale investito. Si raccomanda di effettuare sempre le proprie ricerche e, se necessario, di rivolgersi a un consulente abilitato.
Merlintrader Trading Pub
Biotech catalyst news and analysis. FDA PDUFA tracker
Merlintrader Trading Pub
Biotech catalyst news and analysis. FDA PDUFA tracker
? AMZE – Daily Catalyst Report
Amaze Holdings Inc. – Fact-Based AnalysisAmaze Holdings Inc. – Fact-Based Analysis
? Report Date:Report Date: November 12, 2025
⏰ Ora:Time: 12:55 PM CET
? Verified Data
Prezzo Range Intraday:Current Price Range (Intraday):
$0.43 – $0.62
Pre-Market Movement (Nov 12):Pre-Market Movement (Nov 12):
+68.4%
Volume vs Average:Volume vs Average:
2.89M / 252.7K avg = 11.4x
52-Week Price Range:52-Week Price Range:
$0.43 (low) – $20.24 (high)

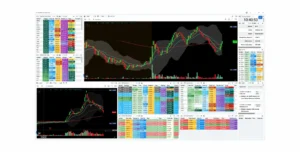
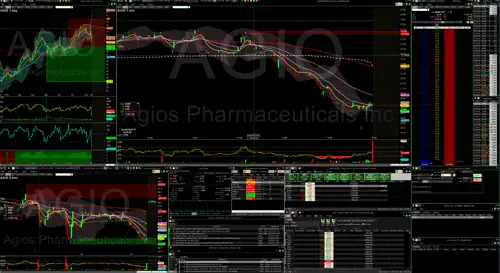
? Candele Giapponesi – Attività Intraday AMZE (Nov 12, 2025)
? Japanese Candlestick Chart – AMZE Intraday Activity (Nov 12, 2025)
? Dati Osservati – Nov 12, 2025? Observed Data – Nov 12, 2025
| MetricaMetric | ValoreValue | ContestoContext |
|---|---|---|
| Pre-Market SpikePre-Market Spike | +68.4% | Range: $0.54 → $0.8934Range: $0.54 → $0.8934 |
| Intraday RangeIntraday Range | $0.43 – $0.62 | Volatilità significativaSignificant volatility |
| VolumeVolume | 2.89M | 11.4x sopra media |
| Market CapMarket Cap | $3.45M – $11M | Dipende da prezzo corrente |
| 52-Week Range52-Week Range | $0.43 – $20.24 | -97.9% da high |
? Metriche Aziendali (TTM)? Company Metrics (TTM)
RevenueRevenue
$299K
Osservazione: Revenue molto bassa per azienda quotataObservation: Very low revenue for public company
Net LossNet Loss
-$2.52M
Osservazione: Perdite nette significativamente superiori a revenueObservation: Net losses significantly exceed revenue
Estimated Cash RunwayEstimated Cash Runway
6-12 mesi
Osservazione: Basato su burn rate correnteObservation: Based on current burn rate
? Prossimi Catalizzatori? Upcoming Catalysts
Q4 2025 EarningsQ4 2025 Earnings
Stimato: Nov 17, 2025Est: Nov 17, 2025
Earnings call scheduled. Data dati storici, timeline è entro 5 giorni dalla data di report.
Earnings call scheduled. Based on historical data, timeline is within 5 days from report date.
? Nota: Earnings dates generano variabilità di prezzo importante su micro-cap? Note: Earnings dates create significant price variability on micro-caps
Adobe India RolloutAdobe India Rollout
Timeline: Q4 2025 – Q1 2026 (stimato)Timeline: Q4 2025 – Q1 2026 (est)
Implementazione della partnership Adobe nel mercato indiano. Nessun dettagli specifici di timeline forniti da company.
Implementation of Adobe partnership in Indian market. No specific timeline details provided by company.
? Nota: Timeline vague può estendersi oltre le aspettative? Note: Vague timeline can extend beyond expectations
Potential Funding RoundPotential Funding Round
Timeline: 6-12 mesi (urgenza)Timeline: 6-12 months (urgent)
Data cash runway di 6-12 mesi, funding sarà probabilmente necessario. Se annunciato, tipicamente include diluzione di shares.
Given 6-12 month cash runway, funding will likely be necessary. If announced, typically includes share dilution.
? Nota: Funding announcements su micro-caps hanno storicamente impattato il prezzo? Note: Funding announcements on micro-caps historically impact price
? Fonti Verificate:? Verified Sources:
✓ Benzinga (News catalyst Nov 12)
✓ CNN (Price/forecast data)
✓ TradingView (Chart data)
✓ Yahoo Finance (Company metrics)
✓ Robinhood (Live price data)
? Report Updated:? Report Updated: November 12, 2025 – 12:55 PM CET
✓ Benzinga (News catalyst Nov 12)
✓ CNN (Price/forecast data)
✓ TradingView (Chart data)
✓ Yahoo Finance (Company metrics)
✓ Robinhood (Live price data)
? Report Updated:? Report Updated: November 12, 2025 – 12:55 PM CET
Scanner for active traders

Try ChartsWatcher free, then unlock 10% OFF with SAVE10
ChartsWatcher is a real-time scanner for momentum traders: fast movers, unusual volume and rotations — so you can focus on the few tickers that matter right now, instead of watching hundreds of charts.
Start with the free version. When you upgrade, use SAVE10 for 10% OFF your first paid period.
Start free – then use SAVE10
No credit card required to start. Apply SAVE10 when upgrading.
Recommended platform
One platform. All your brokers.
Medved Trader connects multiple brokers in one workspace, with pro charts, hotkeys and fast execution — without changing your broker accounts.
A single cockpit for positions, Level II and multi-broker order routing, built for active day & swing traders.
Get 1 Month Free ➔
Multi-broker workflow + customizable layouts in one platform.
If you find value in the work I publish on Merlintrader and want a practical AI assistant for research and writing, you can sign up using this referral link. Click here to try Monica.im and support the site
Find out how I use AI on Merlintrader: AI, retail and Merlintrader
Disclosure: some of the links in the promotional blocks above are affiliate or referral links. If you choose to subscribe or sign up through them, Merlintrader may receive a small commission or benefit at no extra cost to you.
